Wednesday, 18 May 2022

Kubernetes installation


Set up Docker

Step 1: Install Docker

Kubernetes requires an existing Docker installation. If you already have Docker installed, skip ahead to Step 2.

If you do not have Kubernetes, install it by following these steps:

1. Update the package list with the command:

sudo apt-get update

2. Next, install Docker with the command:

sudo apt-get install docker.io

3. Repeat the process on each server that will act as a node.

4. Check the installation (and version) by entering the following:

docker ––version

Step 2: Start and Enable Docker

1. Set Docker to launch at boot by entering the following:

sudo systemctl enable docker

2. Verify Docker is running:

sudo systemctl status docker

To start Docker if it’s not running:

sudo systemctl start docker

3. Repeat on all the other nodes.


Install Kubernetes

Step 1: Install Kubernetes

In this step, we will be installing Kubernetes. Just like you did with Docker in the prerequisites, you must run the commands in both nodes to install Kubernetes. Use ssh to login into both nodes and proceed. You will start by installing the apt-transport-httpspackage which enables working with http and https in Ubuntu’s repositories. Also, install curl as it will be necessary for the next steps. Execute the following command:

Then, add the Kubernetes signing key to both nodes by executing the command:

Next, we add the Kubernetes repository as a package source on both nodes using the following command:

After that, update the nodes:

  • Install Kubernetes tools

Once the update completes, we will install Kubernetes. This involves installing the various tools that make up Kubernetes: kubeadm, kubelet, kubectl, and kubernetes-cni. These tools are installed on both nodes. We define each tool below:

  • kubelet – an agent that runs on each node and handles communication with the master node to initiate workloads in the container runtime. Enter the following command to install kubelet:

  • kubeadm – part of the Kubernetes project and helps initialize a Kubernetes cluster. Enter the following command to install the kubeadm:

  • kubectl – the Kubernetes command-line tool that allows you to run commands inside the Kubernetes clusters. Execute the following command to install kubectl:

  • kubernetes-cni – enables networking within the containers ensuring containers can communicate and exchange data. Execute the following command to install:

Optionally, you can install all four in a single command:

Step 2: Disabling Swap Memory

Kubernetes fails to function in a system that is using swap memory. Hence, it must be disabled in the master node and all worker nodes. Execute the following command to disable swap memory:

This command disables swap memory until the system is rebooted. We have to ensure that it remains off even after reboots. This has to be done on the master and all worker nodes. We can do this by editing the fstab file and commenting out the /swapfile line with a #. Open the file with the nano text editor by entering the following command:

Inside the file, comment out the swapfile line as shown in the screenshot below:

install Kubernetes fstab swap disable

If you do not see the swapfile line, just ignore it. Save and close the file when you are done editing. Follow the same process for both nodes. Now, swap memory settings will remain off, even after your server reboots.

Step 3: Setting Unique Hostnames

Your nodes must have unique hostnames for easier identification. If you are deploying a cluster with many nodes, you can set it to identify names for your worker nodes such as node-1, node-2, etc. As we had mentioned earlier, we have named our nodes as kubernetes-master and kubernetes-worker. We have set them at the time of creating the server. However, you can adjust or set yours if you had not already done so from the command line. To adjust the hostname on the master node, run the following command:

On the worker node, run the following command:

You may close the current terminal session and ssh back into the server to see the changes.

Step 4: Letting Iptables See Bridged Traffic

For the master and worker nodes to correctly see bridged traffic, you should ensure net.bridge.bridge-nf-call-iptables is set to 1 in your config. First, ensure the br_netfilter module is loaded. You can confirm this by issuing the command:

Optionally, you can explicitly load it with the command:

Now, you can run this command to set the value to 1:

Step 5: Changing Docker Cgroup Driver

By default, Docker installs with cgroupfs as the cgroup driver. Kubernetes recommends that Docker should run with systemdas the driver. If you skip this step and try to initialize the kubeadm in the next step, you will get the following warning in your terminal:

On both master and worker nodes, update the cgroupdriver with the following commands:

Then, execute the following commands to restart and enable Docker on system boot-up:

Once that is set, we can proceed to the fun stuff, deploying the Kubernetes cluster!

Step 6: Initializing the Kubernetes Master Node

The first step in deploying a Kubernetes cluster is to fire up the master node. While on the terminal of your master node, execute the following command to initialize the kubernetes-master:

If you execute the above command and your system doesn’t match the expected requirements, such as minimum RAM or CPU as explained in the Prerequisites section, you will get a warning and the cluster will not start:

install Kubernetes InitError

Note: If you are building for production, it’s a good idea to always meet the minimum requirements for Kubernetes to run smoothly. However, if you are doing this tutorial for learning purposes, then you can add the following flag to the kubeadm init command to ignore the error warnings:
sudo kubeadm init --ignore-preflight-errors=NumCPU,Mem --pod-network-cidr=10.244.0.0/16

The screenshot below shows that the initialization was successful. We have also added a flag to specify the pod network with the IP 10.244.0.0, It’s the default IP that the kube-flannel uses. We will discuss more on the pod network in the next step.

install Kubernetes Kubeadm Init

In the output, you can see the kubeadm join command (we’ve hidden our IP address) and a unique token that you will run on the worker node and all other worker nodes that you want to join onto this cluster. Next, copy-paste this command as you will use it later in the worker node.

In the output, Kubernetes also displays some additional commands that you should run as a regular user on the master node before you start to use the cluster. Let’s run these commands:

We have now initialized the master node. However, we also have to set up the pod network on the master node before we join the worker nodes.

Step 7: Deploying a Pod Network

A pod network facilitates communication between servers and it’s necessary for the proper functioning of the Kubernetes cluster. You can read more about Kubernetes Cluster Networking from the official docs. We will be using the Flannel pod network for this tutorial. Flannel is a simple overlay network that satisfies the Kubernetes requirements.

Before we deploy the pod network, we need to check on the firewall status. If you have enabled the firewall after following step 5 of the tutorial on setting up your Ubuntu server, you must first add a firewall rule to create exceptions for port 6443 (the default port for Kubernetes). Run the following ufw commands on both master and worker nodes:

After that, you can run the following two commands to deploy the pod network on the master node:

This may take a couple of seconds to a minute depending on your environment to load up the flannel network. Run the following command to confirm that everything is fired up:

The output of the command should show all services status as running if everything was successful:

install Kubernetes Pod Status

You can also view the health of the components using the get component status command:

install Kubernetes Component Status

This command has a short form cs:

Component Status Short

If you see the unhealthy status, modify the following files and delete the line at (spec->containers->command) containing this phrase ---port=0 :

Do the same for this file:

Finally, restart the Kubernetes service:

Step 8: Joining Worker Nodes to the Kubernetes Cluster

With the kubernetes-master node up and the pod network ready, we can join our worker nodes to the cluster. In this tutorial, we only have one worker node, so we will be working with that. If you have more worker nodes, you can always follow the same steps as we will explain below to join the cluster.

First, log into your worker node on a separate terminal session. You will use your kubeadm join command that was shown in your terminal when we initialized the master node in Step 6. Execute the command:

You should see similar output like the screenshot below when it completes joining the cluster:

Worker Join

Once the joining process completes, switch the master node terminal and execute the following command to confirm that your worker node has joined the cluster:

In the screenshot from the output of the command above, we can see that the worker node has joined the cluster:

install Kubernetes K8S Node Status

Step 9: Deploying an Application to the Kubernetes Cluster

At this point, you have successfully set up a Kubernetes cluster. Let’s make the cluster usable by deploying a service to it. Nginx is a popular web server boasting incredible speeds even with thousands of connections. We will deploy the Nginx webserver to the cluster to prove that you can use this setup in a real-life application.

Execute the following command on the master node to create a Kubernetes deployment for Nginx:

You can view the created deployment by using the describe deployment command:

Nginx Deployment

To make the nginx service accessible via the internet, run the following command:

NodePort Svc Create

The command above will create a public-facing service for the Nginx deployment. This being a nodeport deployment, Kubernetes assigns the service a port in the range of 32000+.

You can get the current services by issuing the command:

NodePort Svc Status

You can see that our assigned port is 32264. Take note of the port displayed in your terminal to use in the next step.

To verify that the Nginx service deployment is successful, issue a curl call to the worker node from the master. Replace your worker node IP and the port you got from the above command:

You should see the output of the default Nginx index.html:

Curl Nginx Svc

Optionally, you can visit the worker node IP address and port combination in your browser and view the default Nginx index page:

install Kubernetes Nginx Webpage

You can delete a deployment by specifying the name of the deployment. For example, this command will delete our deployment:

We have now successfully tested our cluster!

Conclusion

In this tutorial, you have learned how to install a Kubernetes cluster on Ubuntu 20.04. You set up a cluster consisting of a master and worker node. You were able to install the Kubernetes toolset, created a pod network, and joined the worker node to the master node. We also tested our concept by doing a basic deployment of an Nginx webserver to the cluster. This should work as a foundation to working with Kubernetes clusters on Ubuntu.

While we only used one worker node, you can extend your cluster with as many nodes as you wish. If you would like to get deeper into DevOps with automation tools like Ansible, we have a tutorial that delves into provisioning Kubernetes cluster deployments with Ansible and Kubeadm, check it out. If you want to learn how to deploy a PHP application on a Kubernetes cluster check this tutorial.

Happy Computing!


Kubernetes installation.


Saturday, 23 April 2022

Deleting PV and PVC in Kubernetes


HINT: PV volumes may be described like pvc-name-of-volume which may be confusing!

  • PV: Persistence Volume
  • PVC: Persistence Volume Clame
  • Pod -> PVC -> PV -> Host Machine

  1. First find the pvs: kubectl get pv -n {namespace}

  2. Then delete the pv in order set status to Terminating

kubectl delete pv {PV_NAME}

  1. Then patch it to set the status of pvc to Lost: kubectl patch pv {PV_NAME} -p '{"metadata":{"finalizers":null}}'

  2. Then get pvc volumes: kubectl get pvc -n storage

  3. Then you can delete the pvc: kubectl delete pvc {PVC_NAME} -n {namespace}

Monday, 28 March 2022

Sunday, 28 March 2021

Apple Thunderbolt NHI kext big sur reboot issue fix

 Normal boot

sudo fdesetup disable
fdesetup status => should read FileVault is Off

Boot in recovery mode

csrutil disable
csrutil authenticated-root csrutil
mount -uw /Volumes/"SYSTEM_HDD_NAME"
cd /Volumes/"SYSTEM_HDD_NAME"/System/Library/Extensions
mv AppleThunderboltNHI.kext AppleThunderboltNHI.kext.BAK
rm -rf /System/Library/Caches/*
kmutil install -u --force --volume-root /Volumes/"SYSTEM_HDD_NAME"/System/Library/Extensions
bless -folder /Volumes/"SYSTEM_HDD_NAME"/System/Library/CoreServices —bootefi --create-snapshot

Boot normaly

Done

Symptoms

  • You are working and suddenly the machine powers off.
  • The apple logo (and maybe the keyboard retro-lighting) stays on for a few seconds.
  • Then the machines powers off.
  • When you press the power key, the machine boots normally and no error message appears.

If this has happened to you, you are probably at the right place.

What happened ?

For certain Macbooks, there is a faulty component on their logic board (see this Stack Echange postthis MacRumor threadthis change.org petition) that forces the machine into deep sleep.

Changing this component requires skill, time and money that note everyone may have. If you macbook is under warranty, I would recommend you to go to the nearest AppleStore to get it fixed (in some case, it has resulted to have been not enough, and the presented solution was also required).

Otherwise this guide is for you.

Here, we are going to prevent the file AppleThunderboltNHI.kext from being used during boot. This file is a driver for connecting Ethernet through thunderbolt connector. It is also faulty on certain macbook and contributes in the go to sleep mode behaviour by wrongly changing the voltage of the CPU.

WARNING

The solution will permanently require you to deactivate SIP and FireVault. There is no other way here untill Apple does something about it.

Detailed solution

Here is the cooking recipe for solving the problem under Big Sur:

  1. Boot normally

  2. Play a video in the background, for instance this one to keep the CPU busy while we work.

  3. Open a Terminal

  4. Deactive FileVault as follows:
     sudo fdesetup disable
    

    And press the “Enter” key to execute the command.

    you can get you username using the command whoami your password is the session password

  5. Now we have to wait for the hardrive to be de-encrypter. To check on the process you may run from time to time:

     fdesetup status
    

    for those using brew, I recommend using watch fdesetup status

  6. When the decryption processus has reached 100 or when you will read FileVault is Off, we can move on.

  7. Reboot into recovery mode (hold down "cmd" + "R" keys when the machine powers up)

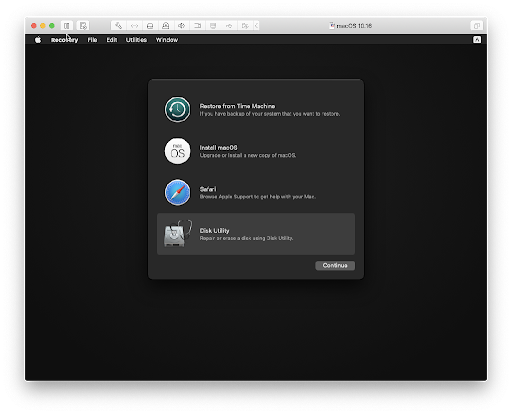
    You should see the following screen at some point

    Recovery Mode Window

  8. On the top menu bar, goto Utilities > Terminal

  9. Now we are going to turn off SIP
     csrutil disable
     csrutil authenticated-root csrutil
    
  10. We are going to mount the root HDD

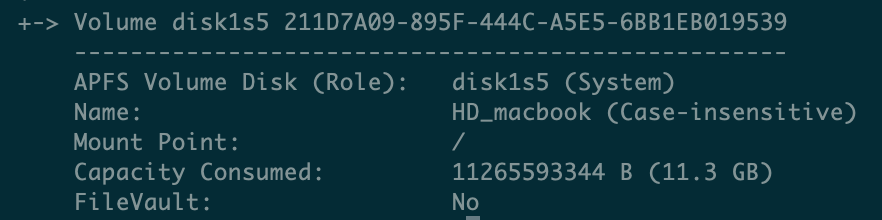
    If you don’t know what is your root HDD, you can run :

    diskutil apfs list
    

    Your root HDD is the one whose (Role) in the label APFS Volume Disk matches “(System)” Root HDD

    To mount in writing mode the HDD, use the following command and susbtitute SYSTEM_HDD_NAME with the name for you root HDD:

    mount -uw /Volumes/"SYSTEM_HDD_NAME"
    

    In the previous image SYSTEM_HDD_NAME was “HD_macbook”. To avoid issues with spaces in a name, use quotes “” around the name, for instance “HD Macbook”

    You can also escape spaces using backslashe -> HD\ Macbook

  11. Now let’s move to the folder /Volumes/”SYSTEM_HDD_NAME”/System/Library/Extensions, deactivate the faulty driver and clear the caches. Don’t forget to change SYSTEM_HDD_NAME for the actual name of your HDD:

    cd /Volumes/"SYSTEM_HDD_NAME"/System/Library/Extensions
    mv AppleThunderboltNHI.kext AppleThunderboltNHI.kext.BAK
    rm -rf /System/Library/Caches/*
    
  12. We have to update the kext cache and select the snapshot for the next boot:
    kmutil install -u --force --volume-root /Volumes/"SYSTEM_HDD_NAME"/System/Library/Extensions
    bless -folder /Volumes/"SYSTEM_HDD_NAME"/System/Library/CoreServices —bootefi --create-snapshot
    
  13. We will not enable SIP anymore. Enabling SIP has proven to create boot loops after modyfing operating system files.

  14. You are done and can reboot in normal mode.

  15. (Optional) reactivate FileVault (may not work)

    sudo fdesetup enable
    

    Or from the System Preferences GUI.

  16. If you install any OS updates, it is very likely that you will need to redo all the steps.

  17. To check that it worked, you can have a look at the About This Max > System Report > Hardware > Thunderbolt and you should read “No driver loaded”. You can also run the folowing command

    kextstat | grep NHI
    

    and you should not see any mention of “AppleThunderboltNHI.kext”

Resources

Thursday, 14 January 2021

Multi-Account Log Aggregation in AWS for Observability and Operations - Part 2: Implementation


Multi-Account Log Aggregation in AWS for Observability and Operations - Part 2: Implementation


In my previous blog, we discussed 3 different ways of aggregating and processing logs from multiple accounts within AWS. These methods were :
1. Cloudwatch Logs plus Lambda Method
2. Cloudwatch Logs plus AWS SQS (Simple Queue Service) Method
3. Cloudwatch Logs plus AWS Kinesis Method

After analyzing the pros and cons based on scenarios, we concluded that using Method #3 is ideal for most of the customers having more than 2 accounts.

In this blog, I will walk through step by step process for setting up Method #3 for aggregating logs.

Overview of Method #3 - Cloudwatch Logs plus AWS Kinesis

Before we start the setup, let’s take a quick look at the architecture for Method #3.

Method_3_with_aws_kinesis

The following resources will be used during the setup:

  1. AWS VPC Flow Logs
  2. AWS CloudTrail
  3. AWS GuardDuty
  4. AWS CloudWatchLogs
  5. Amazon Kinesis Stream
  6. Amazon Kinesis Firehose
  7. AWS Lambda
  8. AWS S3 / RedShift
  9. Amazon ElasticSearch

Steps

Let’s now go through one step at a time. As I demonstrate these steps, I will be using a combination of AWS CLI and the AWS Web Console.

NOTE: Not all features can be configured from the AWS Web Console.

Initial Master Account Setup

Step 1: Create ElasticSearch Cluster (Master/Logging Account)

Refer to this article to setup your ElasticSearch cluster in the MASTER/CENTRALIZED LOGGING account.

Step 2: Create S3 buckets (Master/Logging Account)

Create two s3 buckets in the master account.

The first S3 bucket would be for collecting logs processed by Kinesis Firehose (described later) as well as logs that failed the log processing stage. I will call this bucket demo-logs-s3. DO NOT ATTACH any additional policy to this bucket.

The second S3 bucket would be for backing up/collecting all the cloud-trail logs from member accounts to the Master/Logging account. I will call this bucket cloudtrail-all-accounts-demo.

The cloudtrail-all-accounts-demo bucket needs a bucket policy that allows member accounts to write to this bucket.

{
  "Version": "2012-10-17",
  "Statement": [
    {
      "Sid": "AWSCloudTrailAclCheck20131101",
      "Effect": "Allow",
      "Principal": {
        "Service": "cloudtrail.amazonaws.com"
      },
      "Action": "s3:GetBucketAcl",
      "Resource": "arn:aws:s3:::cloudtrail-all-accounts-demo"
    },
    {
      "Sid": "AWSCloudTrailWrite20131101",
      "Effect": "Allow",
      "Principal": {
        "Service": "cloudtrail.amazonaws.com"
      },
      "Action": "s3:PutObject",
      "Resource": [
        "arn:aws:s3:::cloudtrail-all-accounts-demo/AWSLogs/MEMBER_ACCOUNT_ID_1/*",
        "arn:aws:s3:::cloudtrail-all-accounts-demo/AWSLogs/MEMBER_ACCOUNT_ID_2/*"
      ],
      "Condition": { 
        "StringEquals": { 
          "s3:x-amz-acl": "bucket-owner-full-control" 
        }
      }
    }
  ]
}

Step 3: Setup Kinesis Data Stream (Master/Logging Account)

In the Master/Logging account, navigate to Services > Kinesis > Data Streams > Create Kinesis Stream .

The number of shards that you need to provision depends on the size of logs being ingested. There is an evaluation tool available on AWS that helps you with estimation.

create_kinesis_stream_1

It’s always a best practice to modify the Data Retention Period for Kinesis Stream. The default retention period is 24 hours and the max can be 7 days. To modify this, you can edit the stream created above and update it.

To perform the same operation from CLI, run

aws kinesis create-stream --stream-name Demo_Kinesis_Stream --shard-count 4

Use this command to increase the retention period

aws kinesis increase-stream-retention-period --stream-name Demo_Kinesis_Stream --retention-period-hours 168

Step 4: Setup Kinesis Firehose (Master/Logging Account)

Select the Kinesis Data Stream created in Step 3 and click on Connect Kinesis Consumers > Connect Delivery Stream

create_firehose_1

Moving on to the Process records step, you can also set up a data transformation function that will parse the incoming logs to analyze only those which are important. Click on Enabled and choose a lambda function that will do this transformation.

NOTE: Kinesis Firehose expects a particular data format. Refer here for more info.

create_firehose_2

If you don’t have any existing lambda functions to do this then click on Create New and Select Kinesis Firehose Process Record Streams as source.

Change the Runtime for lambda to python 3.6 and Click Next

Use the code from this repository within your Lambda function.

import base64
import gzip
import io
import json
import zlib

def cloudwatch_handler(event, context):
    output = []

    for record in event['records']:
      compressed_payload = base64.b64decode(record['data'])
      uncompressed_payload = gzip.decompress(compressed_payload)
      print('uncompressed_payload',uncompressed_payload)
      payload = json.loads(uncompressed_payload)
      
      # Drop messages of type CONTROL_MESSAGE
      if payload.get('messageType') == 'CONTROL_MESSAGE':
          
          output_record = {
              'recordId': record['recordId'],
              'result': 'Dropped'
          }
          return {'records': output}
     
     
       # Do custom processing on the payload here
      output_record = {
          'recordId': record['recordId'],
          'result': 'Ok',
          'data': base64.b64encode(json.dumps(payload).encode('utf-8')).decode('utf-8')
      }
      output.append(output_record)

    print('Successfully processed {}        records.'.format(len(event['records'])))

    return {'records': output}

Also, modify the Timeout under Basic Settings as shown below.

create_firehose_3

Now, go back to the Kinesis Firehose setup page and select the lambda function. In this step, we won’t be converting the record format as we want to send logs to ElasticSearch and S3.

Next, we need to select a destination to send these processed logs to. In this example, I will be sending it to Amazon ElasticSearch Service.

From the drop-down select the elastic search cluster created in Step 1. Also, select the s3 bucket created in Step 2 to backup the logs for future use. This might be necessary for regulatory and compliance reasons.

create_firehose_4

In the final step, complete the elastic search configuration as per your environment and resilience needs and create a new IAM role that allows Kinesis Firehose to write to ElasticSearch Cluster. Then review the summary and create the delivery stream.

Step 5: Create and Set policies in Master/Logging Account to allow data to be sent from Member Accounts

  • Create policy (cwltrustpolicy.json) to assume the role from CloudWatch Logs

Note: DO NOT USE IAM CONSOLE TO DO THIS

{
  "Statement": {
    "Effect": "Allow",
    "Principal": { "Service": "logs.region.amazonaws.com" },
    "Action": "sts:AssumeRole"
  }
}

Run this in Master/Logging account. You can use profiles in AWS CLI to manage your credentials for different accounts.

aws iam create-role --role-name cwrole --assume-role-policy-document file://cwltrustpolicy.json
  • Create a policy (cwlpermissions.json) to allow CloudWatchLogs to write to Kinesis
{
  "Statement": [
    {
      "Effect": "Allow",
      "Action": "kinesis:PutRecord",
      "Resource": "arn:aws:kinesis:region:<MASTER/LOGGING ACCOUNT ID>:stream/Demo_Kinesis_Stream"
    },
    {
      "Effect": "Allow",
      "Action": "iam:PassRole",
      "Resource": "arn:aws:iam::<MASTER/LOGGING ACCOUNT ID>:role/cwrole"
    }
  ]
}
  • Associate the above policy to cwrole (in Master Account)

    aws iam put-role-policy --role-name cwrole --policy-name cwlpolicy --policy-document file://cwlpermissions.json
    
  • Ensure that the policy was associated. (in Master Account)

    aws iam get-role-policy --role-name cwrole --policy-name cwlpolicy
    
  • Create a destination endpoint to which the logs would be sent (in Master Account)

    aws logs put-destination --destination-name "kinesisDest" --target-arn "arn:aws:kinesis:us-west-2:<MASTER ACCOUNT ID>:stream/Demo_Kinesis_Stream" --role-arn "arn:aws:iam::<MASTER ACCOUNT ID>:role/cwrole"
    

Response from CLI

Logs_put_destination

  • Assign a destination policy that allows other AWS accounts to send data to Kinesis.
{
  "Version": "2012-10-17",
  "Statement": [
    {
      "Sid": "Stmt1571094446639",
      "Action": [
        "logs:PutSubscriptionFilter"
      ],
      "Principal" : {
          "AWS": [
      "MEMBER_ACCOUNT_1_ID",
      "MEMBER_ACCOUNT_2_ID"
      ]
         },
      "Effect": "Allow",
      "Resource": "arn:aws:logs:us-west-2:<MASTER_ACCOUNT_ID>:destination:kinesisDest"
    }
  ]
}

In the Master account run,

aws logs put-destination-policy --destination-name "kinesisDest" --access-policy file://destination_policy.json

Now, let’s set up VPC flow logs in Member Accounts.

Aggregating VPC Flow logs

Step 6: Setup CloudWatch Log Group (Member Account)

The first step is to setup CloudWatch Log group in all the member_account(s). This can be done via AWS CLI/AWS SDK or AWS Web Console.

Navigate to Services > CloudWatch > Logs > Create log group

Step 7: Setup VPC Flow Logs (Member Account)

The first step is to enable VPC Flow logs across all of your VPCs in all of the member_account. This can be done either via AWS CLI, AWS SDK or the web console.

Navigate to Services > VPC > Your VPCs and select the VPC of interest. Then in the bottom pane, click on Flow Logs > Create flow log. I will call it cwl_vpc_fl_member_account_1 (Refers to account 1)

create_flow_log_1

On the next page, Select the Filter. This indicates the type of VPC logs that you want AWS to capture. Choose ALL to log both accepted and rejected traffic. Then select the Destination as CloudWatch Logs.

From the drop-down choose the Destination log group.

create_flow_log_2

Finally, select an IAM role that allows VPC flow logs to be written to the CloudWatch Log group. If this is not already setup, then setup a role either by clicking on Set Up Permissions or by going to IAM and adding the policy, shown below, to a role. (In our case, the role is named Demo_flowlogsrole).

{
  "Statement": [
    {
      "Action": [
        "logs:CreateLogGroup",
        "logs:CreateLogStream",
        "logs:DescribeLogGroups",
        "logs:DescribeLogStreams",
        "logs:PutLogEvents"
      ],
      "Effect": "Allow",
      "Resource": "*"
    }
  ]
}

Copy the ARN of the Demo_flowlogsrole and Repeat the same steps across different accounts.

create_flow_logs_final

This will start forwarding VPC flow logs from all VPCs to the CloudWatch log group

Step 8: Create a subscription filter in Member Account(s) to send data to Kinesis Stream

  • Execute this command to obtain the destination arn from the Master Account [The –profile master stores creds for Master Account for AWS CLI]

    aws logs describe-destinations --profile master
    

It has format similar to arn:aws:logs:us-west-2::destination:kinesisDest

  • Now in the member accounts, setup the subscription filter to forward logs to kinesis

In the command below, use the log group created in step 6.

aws logs put-subscription-filter --log-group-name "cwl_vpc_fl_member_account_1" --destination-arn arn:aws:logs:us-west-2:<MASTER_ACCOUNT_ID>:destination:kinesisDest --filter-name "vpc_flow_logs_filter" --filter-pattern " " --profile dev1

You should now see data in Elastic Search.

Aggregrating CloudTrail Logs

In this section, we will discuss the aggregation of CloudTrail logs. We will use some of the same resources created in the previous step.

  • Enable Cloudtrail in all the regions within Member Accounts.

While enabling across the organization, ensure that the S3 bucket to which the cloudtrail logs are sent is set to the bucket in the Logging/Master account as mentioned in Step 2. This is useful for long term storage of the logs.

create_cloudtrail_1

  • Forward CloudTrail to CloudWatch Logs

Navigate to the CloudTrail Service and click on cloud trail created in the previous step. (demo-cloud-trail)

Then, go to the section Cloudwatch Logs and click on Configure.

create_ct_cwl_1

Provide the name of the Cloudwatch log group

create_ct_cwl_2

This will then take you to the IAM configuration to create a role that gives CloudTrail permission to write to the CloudWatch log group.

iam_role_ct_cwl

  • Now similar to the previous section, create a subscription filter to forward the logs from this CloudWatch log group to kinesis. (in Memeber Account)

    aws logs put-subscription-filter --log-group-name "CloudTrail/member_account_1" --destination-arn arn:aws:logs:us-west-2:<MASTER_ACCOUNT_ID>:destination:kinesisDest --filter-name "ct_filter" --filter-pattern " " 
    

Once this is setup you will start seeing both processed VPC flow logs and CloudTrail events from all the accounts in ElasticSearch.

Aggregating GuardDuty events

  • The first step is to aggregate all GuardDuty events in the MASTER/Logging account. This can be done by sending invitations from the master account to member accounts. All you need is Member account ID and the email associated with the account.

Navigate to Services > GuardDuty > Enable GuardDuty

Then to add member accounts, go to GuardDuty > Accounts > Add Account

Provide the Account ID(s) of the member account and Email for the account. Once you do that, send an invite.

send_invite_gd

  • Go to the Member Account and accept the invite. Before you do so, enable GuardDuty in the member accounts. (You can do this from Terraform or CFT across member accounts.)

accept_invite_gd

You will notice the GuardDuty events from all your member accounts will now be available in the Master/Logging account. This is useful if you like using the GuardDuty UI.

  • Now, similar to other aggregations seen in earlier sections, we will forward these GuardDuty events to CloudWatch logs. (MASTER ACCOUNT)

To do this, go to CloudWatch > Events > Create Rule. Add the following details to it. Note, we are forwarding all the GuardDuty events stored in the Master account to the CloudWatch Log group.

create_cw_rule_for_gd

  • Update the destination policy to allow data from this account to be collected.
{
  "Version": "2012-10-17",
  "Statement": [
    {
      "Sid": "Stmt1571094446639",
      "Action": [
        "logs:PutSubscriptionFilter"
      ],
      "Principal" : {
          "AWS": [
            "MEMBER_ACCOUNT_1_ID",
            "MEMBER_ACCOUNT_2_ID",
            "MASTER_ACCOUNT_ID"
      ]
         },
      "Effect": "Allow",
      "Resource": "arn:aws:logs:us-west-2:<MASTER_ACCOUNT_ID>:destination:kinesisDest"
    }
  ]
}

Run this in Master Account

  aws logs put-destination-policy --destination-name "kinesisDest" --access-policy file://destination_policy.json
  • Finally, we will add a subscription filter to forward these CloudWatch Logs to Kinesis stream similar to the ones in previous sections. (Here we add subscription filter in the MASTER ACCOUNT)

    aws logs put-subscription-filter --log-group-name "/aws/events/guardduty-demo" --destination-arn arn:aws:logs:us-west-2:<MASTER_ACCOUNT_ID>:destination:kinesisDest --filter-name "gd_filter" --filter-pattern " " 
    

This should be the final state of your CloudWatch Log group

cw_final

Kibana DashBoard

After applying necessary filters, you will start noticing the data in Kibana Dashboard

kibana_dashboard

Conclusion

By implementing this architecture, you should get near real-time data in ElasticSearch for analysis (and send notifications using SNS). Also, you should see all the logs/events within your S3 bucket that is stored as a backup. You may choose to set policy so that these logs are archived to Glacier and other long term storage services.

The aggregated logs from the Master/Logging account can be forwarded to other external systems like Splunk/RedShift for analysis and VMWare Secure State for Cloud Security Posture Management.


SOURCE